We develop NEGraf and expect our proposed system to assist an analyst in understanding the intuition of the collapse procedure. [pdf]
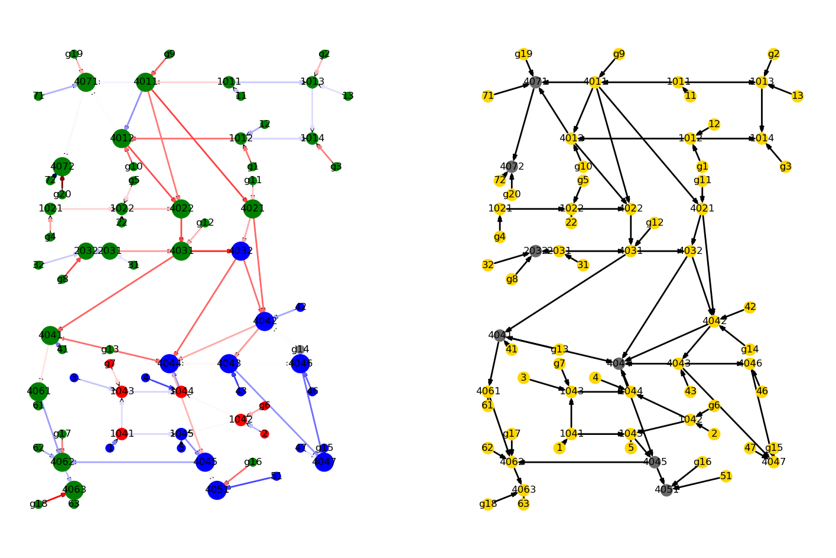
Power flow simulation produces a colossal amount of complex, integrated, and diverse data. An analyst can get lost in those irregular data when understanding the undergoing of the system. Developing a well-performed analysis method and corresponding visualization techniques is essential. This study proposed NEGraf, a system prototype for transforming data into useful information to assist decision-making in power system monitoring. It can explain the system operating status to support the analyst in recognizing the specific phenomenon in collapse before the blackout, an abnormal period. NEGraf contains a node-edge graph module for data representation, a customized edge-weighted PageRank inference algorithm for data analysis, and a colored graph explanatory interface for information display. We ran a user study for a blackout recognition task. The results show that our interface can better explain intuitively dynamic features in collapse and improve accuracy and recall in predicting blackout than a traditional bar visualization interface.
X. Gui, C. -M. Chang and T. Igarashi, "NEGraf: A System for Power System Collapse Explanation using Graph Representation and Customized PageRank," 2022 International Conference on Cyberworlds (CW), 2022, pp. 130-133, doi: 10.1109/CW55638.2022.00029.
P. Aristidou. (2020) Platform for testing wide-area monitoring methods in electric power systems. [Online]. Available: https://sps.cut.ac.cy/post/2019-wide-area-monitoring-power-systems-voltage-stability/